About the Route
Southern Expressway
The Southern Expressway (E01) is Sri Lanka's first expressway, connecting the commercial capital Colombo with the southern coastal cities of Galle, Matara, and Hambantota. It was built to reduce travel time, improve road safety, and stimulate economic development in the Southern Province.
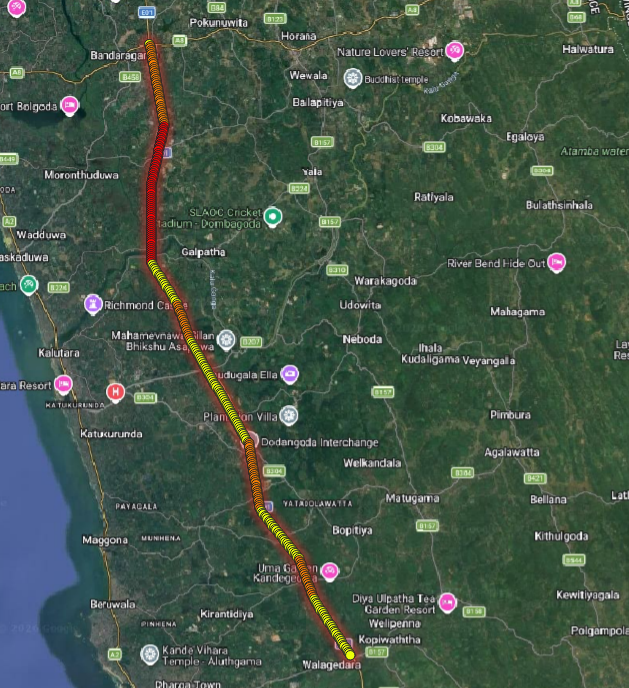
This analysis focuses on the segment from Gelanigama interchange to Pinnaduwa interchange — a 32.1 km stretch that includes elevated sections, sharp curves, and varying pavement conditions.
2011
Year Opened
196 KM
Total E01 Length
100 km/h
Speed Limit
4-Lane
Dual Carriageway
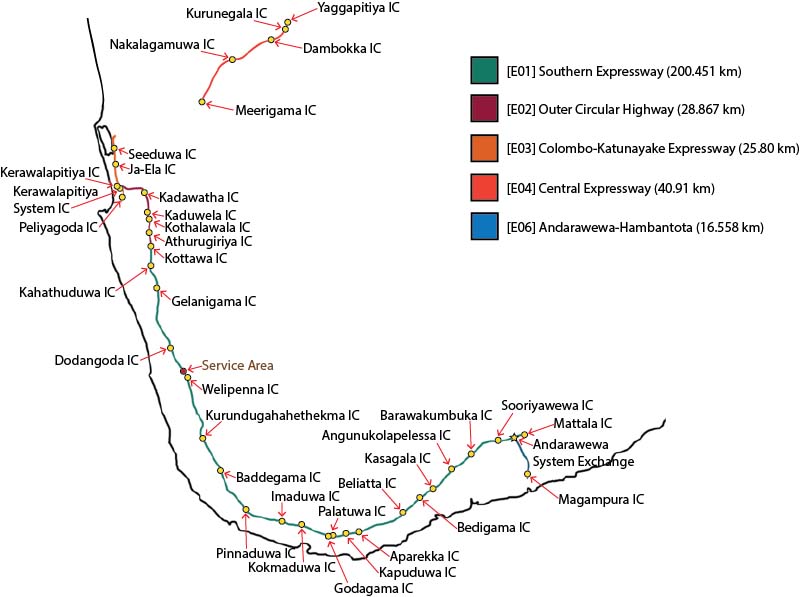
E01 Network